This report displays heat monitoring data across three sections. You can review heat event activity and assess how consistently your team is responding to WBGT alerts.
WBGT Readings
This graph displays WBGT temperature trends for the selected time frame. Weekly and hourly views show 15-minute intervals alongside any actions taken. Monthly and yearly views display historic high and low trends.
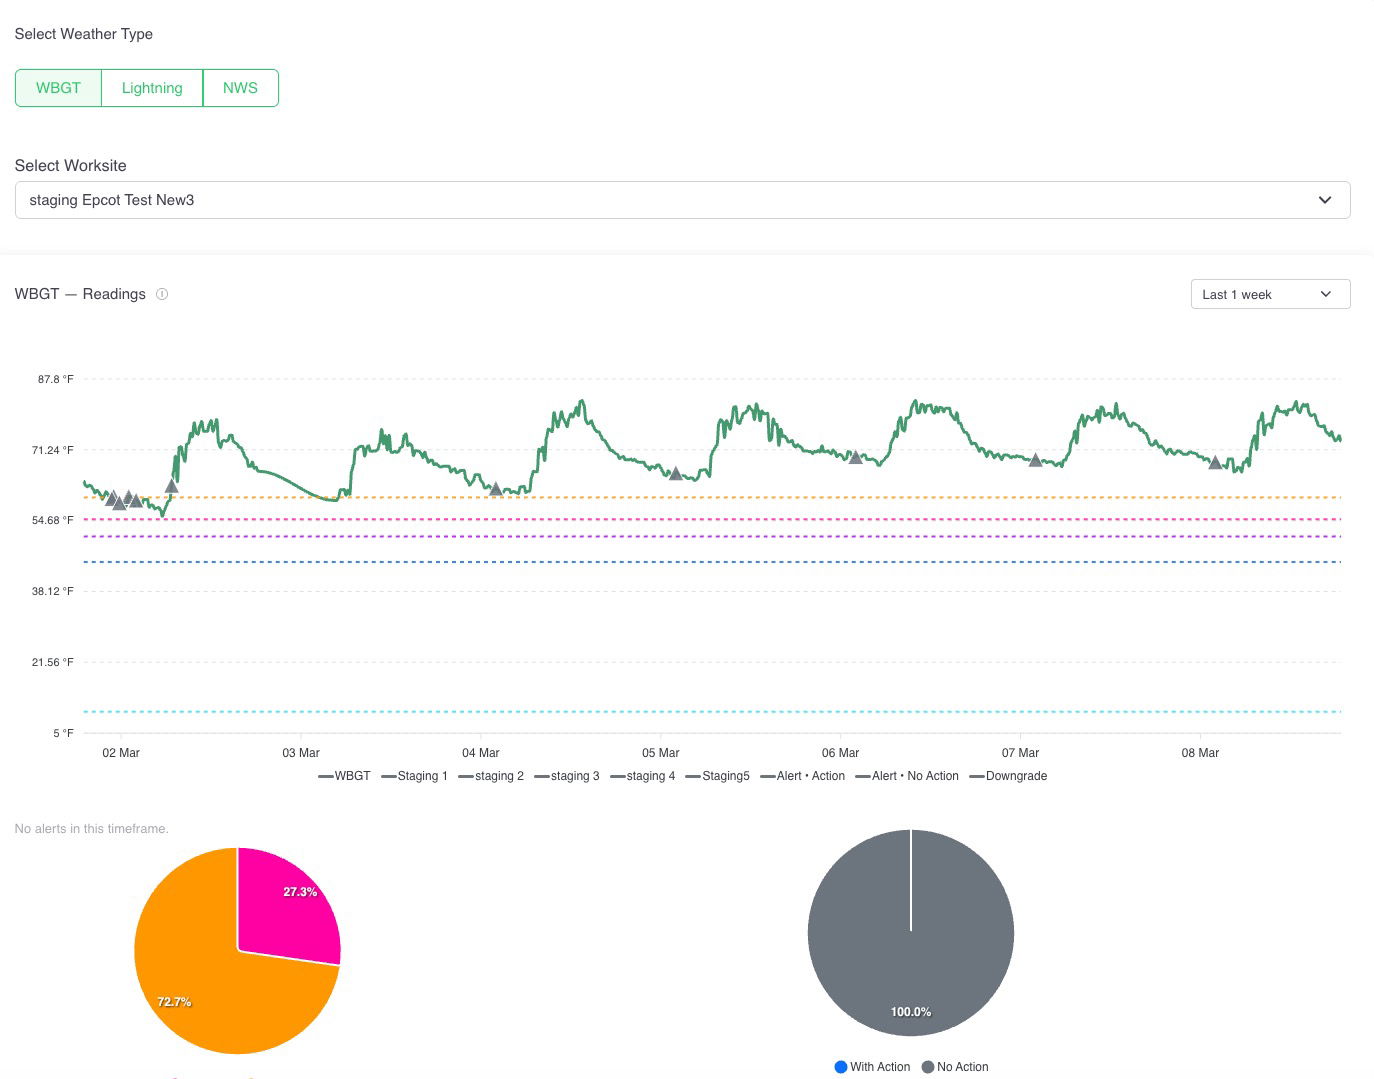
ℹ️ Alerts reset daily between 12–4 AM.
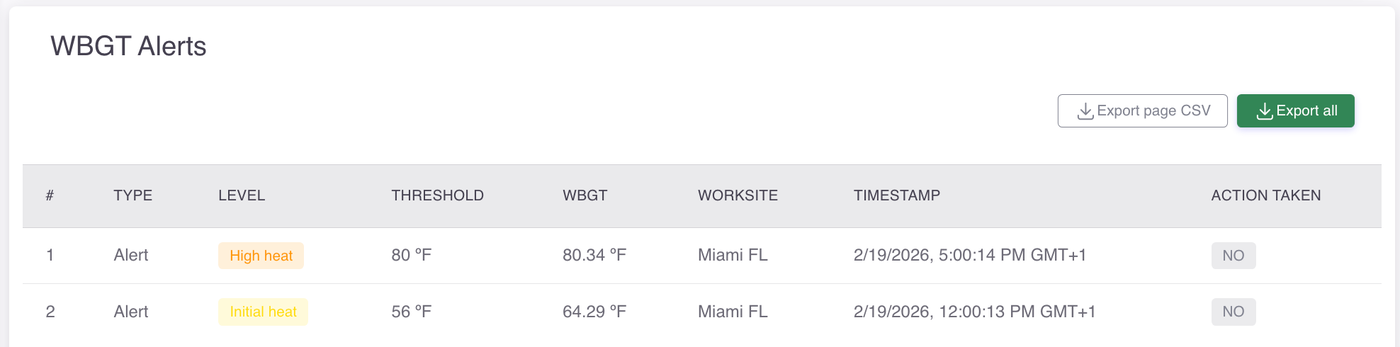
WBGT Alerts
This table logs each alert triggered during the selected time frame, giving you a detailed record of when and where heat thresholds were exceeded, which level was reached, and whether your team took action in response.
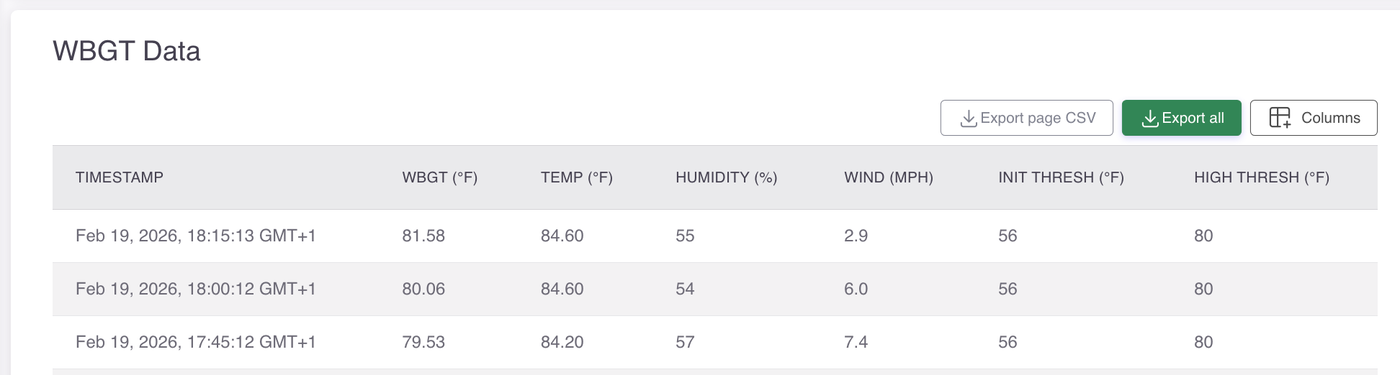
WBGT Data
This table provides a full environmental breakdown for each recorded timestamp, capturing not just the WBGT reading but also the underlying conditions — temperature, humidity, and wind — alongside the thresholds that were in effect at the time.
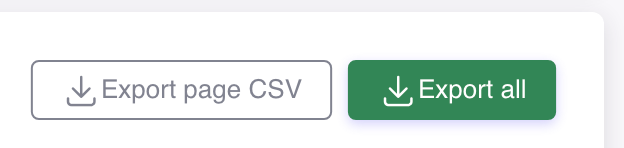
Export features
These buttons are available on the table:
Export page CSV: Exports only the records currently visible on the table.
Export all: Exports the complete dataset, including records on subsequent pages.

💡 You can choose which columns display in the table. See the Columns button.