This report displays air quality monitoring data across three sections. You can review AQI event activity and assess how consistently your team is responding to alerts.
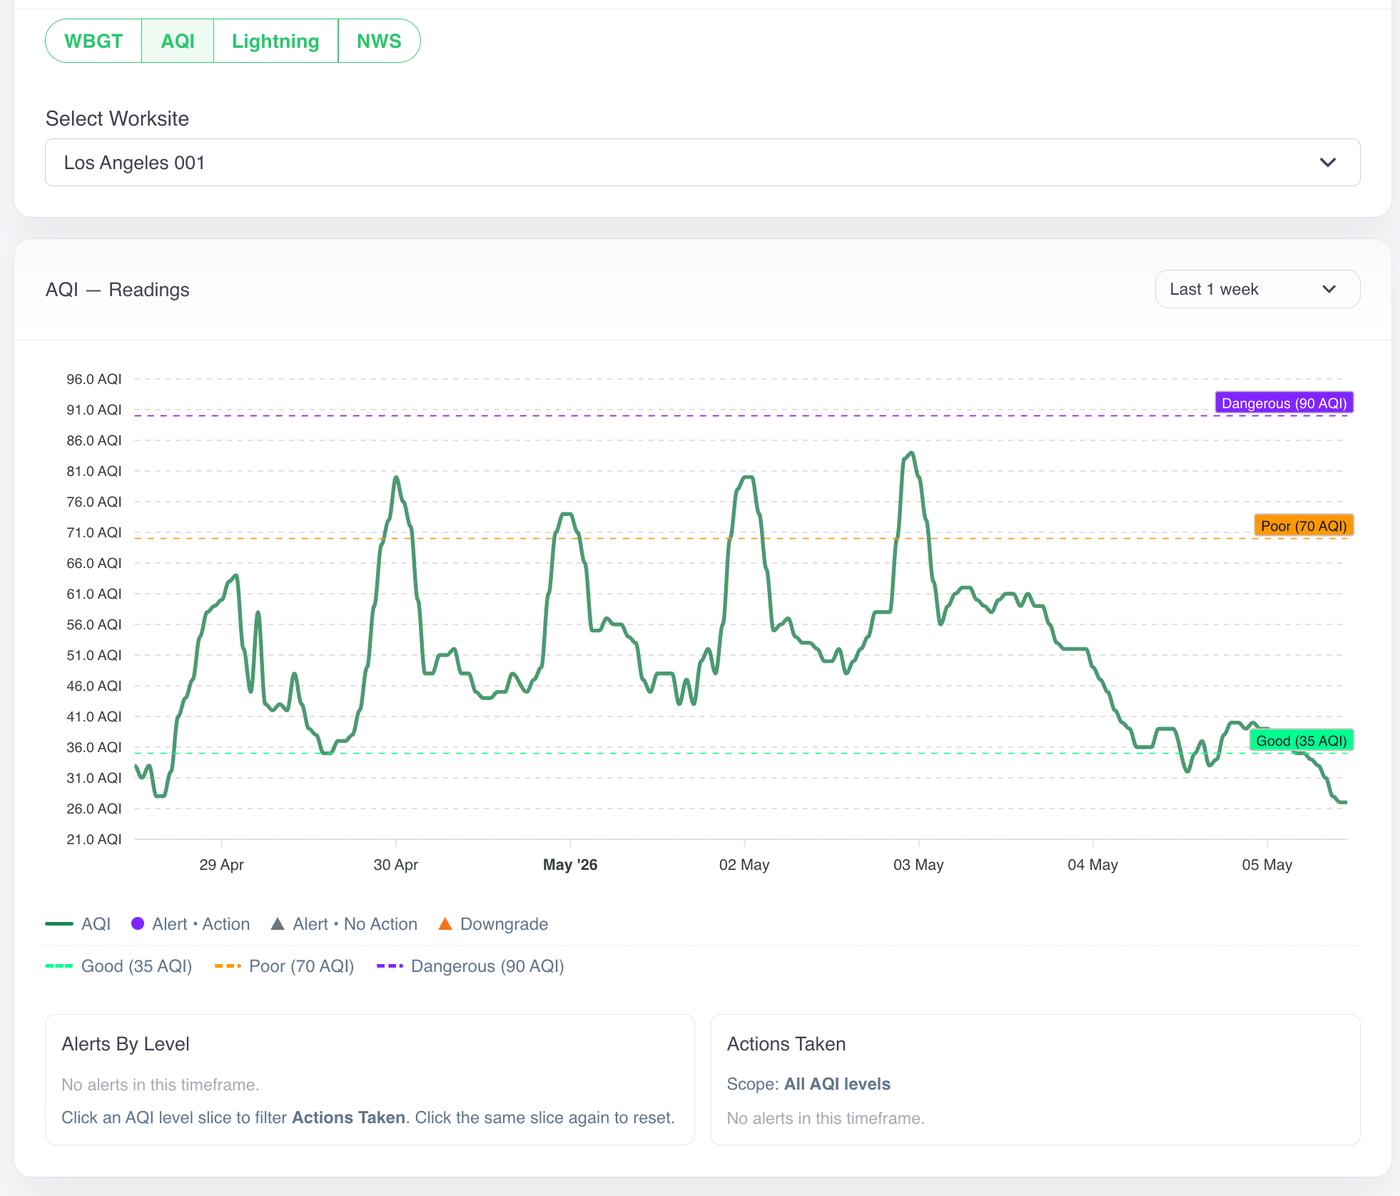
AQI Readings
This graph displays air quality index values over the selected time frame.
AQI Alerts
This table logs each alert triggered during the selected time frame, giving you a detailed record of when and where thresholds were exceeded, which level was reached, and whether your team took action in response.
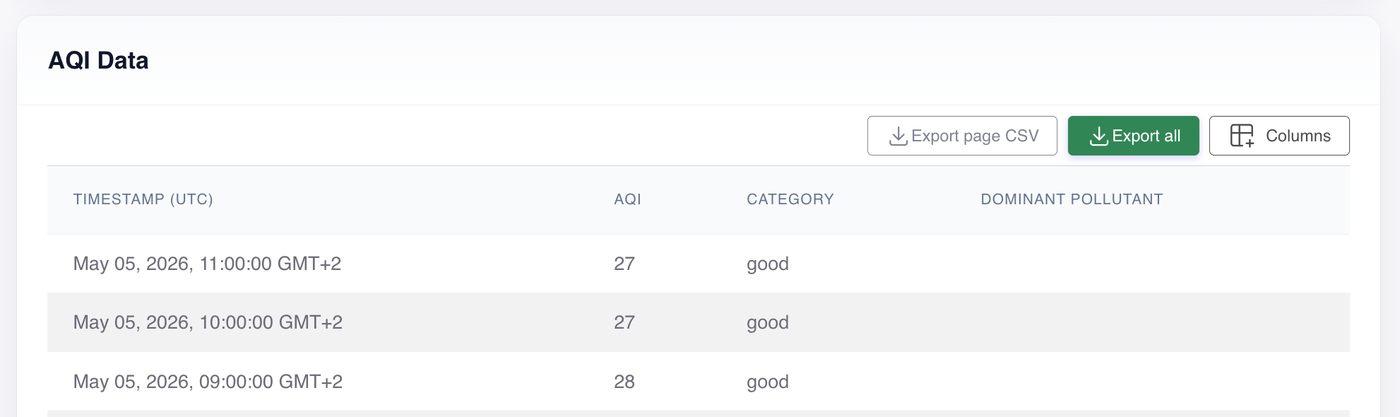
AQI Data
This table logs each recorded reading with its timestamp, AQI value, air quality category, and the dominant pollutant detected at the time.