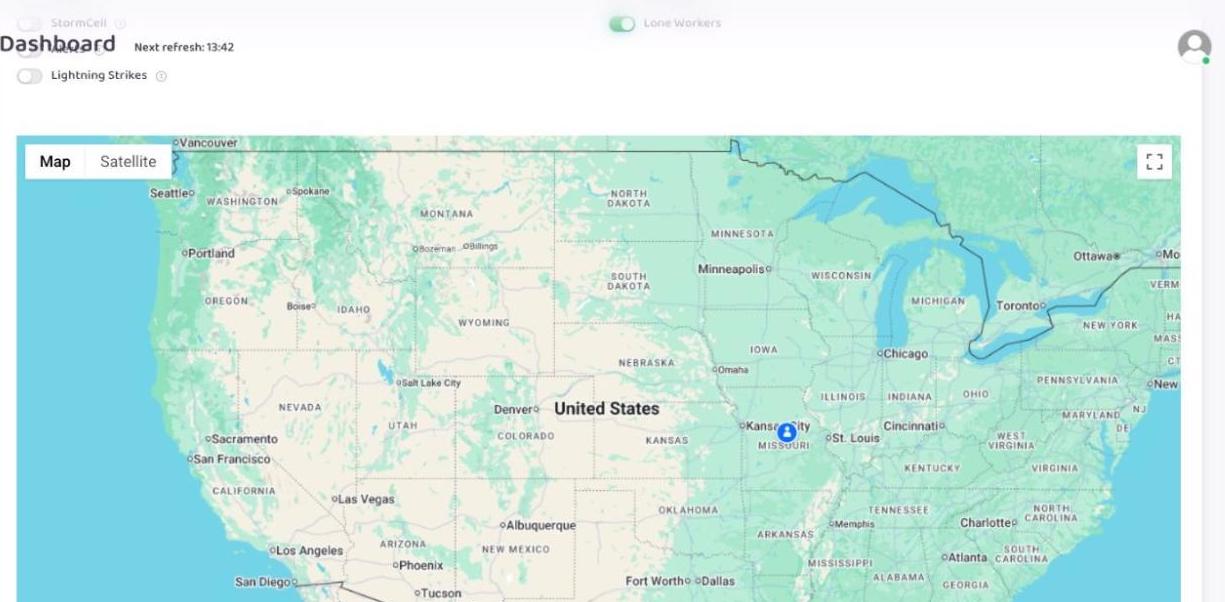
The dashboard provides a high-level overview of the worksites and lone workers assigned to you, and their status.
ℹ️ The dashboard automatically refreshes every 15 minutes. The countdown to the next refresh is displayed at the top of the page.
Worksites Map
The map shows the status and location of all the worksites and lone workers assigned to you. Use the toggles above the map to show/hide weather overlays, worksites, and lone workers.
The legend explained
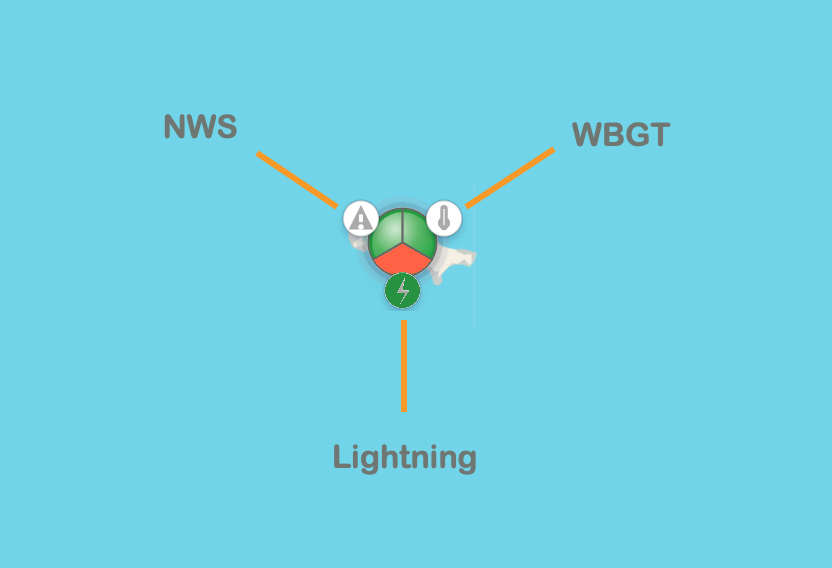
Worksites
The worksite indicators display three alert categories:
WBGT
Lightning
National Weather Service (NWS)
Lone Workers
The lone worker indicators have as many heat levels as configured in the WBGT Settings. For example:
Safe
Initial heat
High heat
💡 TIP
The statuses for each worker, as well as each worksite alert category, are color-coded.
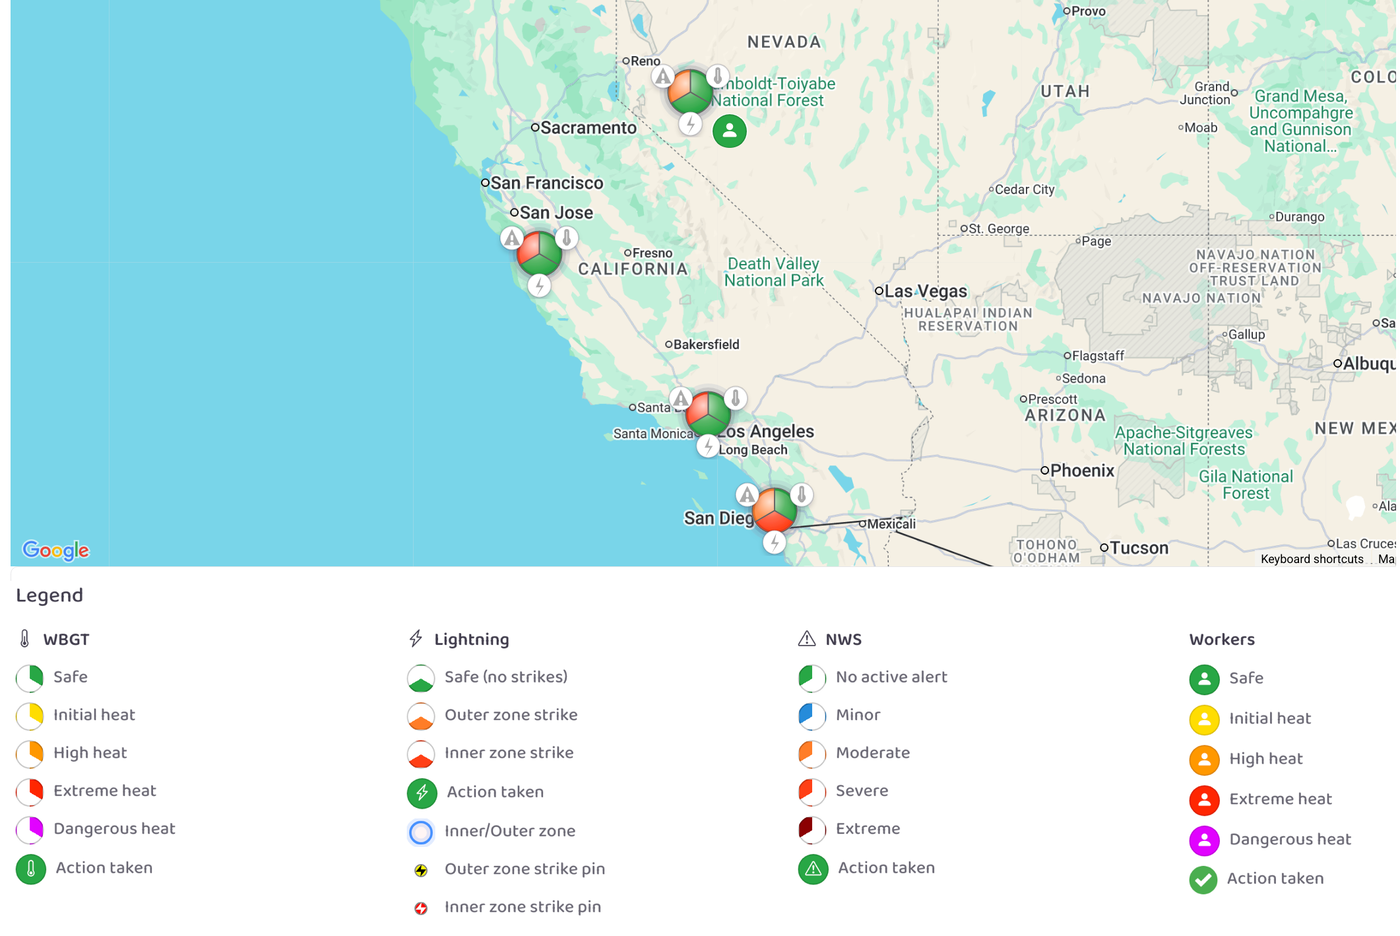
Actions
When a user takes an action on a specific alert, the corresponding icon turns green; otherwise, it remains grayed out.
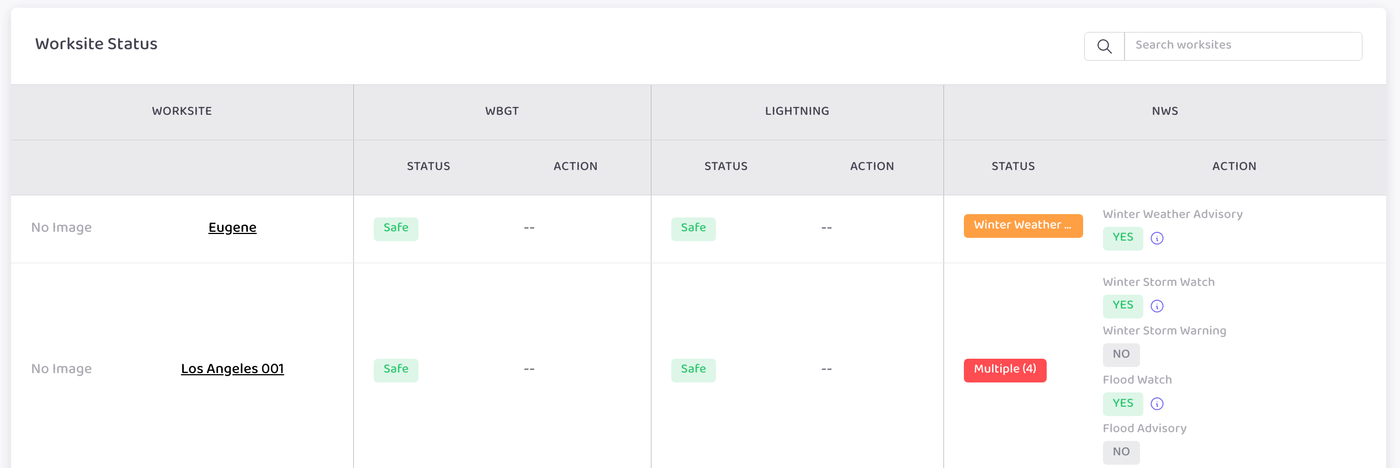
Worksite Status
The Worksite Status section provides a detailed summary of the worksites assigned to you in a table format. Click on a worksite to view the worksite details page and view more information about the worksite, such as the weather forecast, event history, and assigned workers.
Lone Worker Status
The Lone Worker Status section provides a detailed summary of any lone workers at your assigned worksites in a table format. Click on a worker to view the worker's details page and view more information about the worker and their notification history.